The Untapped Grid:

How Better Utilization of the Power System Can Improve Energy Affordability​

Energy affordability has become a headline issue. Electricity rates are rising for several reasons, particularly due to the growing cost of maintaining and expanding an aging power grid. At the same time, electricity demand is increasing, driven by data center development, electrification, and renewed growth in manufacturing. In this study, we examine an emerging opportunity to harness that load growth to improve power system utilization and, in turn, put downward pressure on electricity rates.

Prepared for

Font

Prepared FOR

Improvements in system utilization enable capital-efficient load growth, which puts downward pressure on rates.

How It Works

As the new load pays for a portion of the existing power system, the cost burden for other customers is reduced. A capital-efficient approach to accommodating new load puts downward pressure on rates while still providing utilities with growth opportunities relative to current levels.

Reduce portion of existing power system paid for by existing customers

Rates

At a national average rate of 14 cents/kWh, 1,000 TWh/yr of new annual electricity sales would amount to $140 billion/yr in new energy revenue. A significant portion of that would pay for the existing generation, transmission, and distribution systems.

Recover portion of costs of existing power system from new load

Sales

Analysts project annual U.S. electricity demand could increase by 25% (1,000 TWh/yr) over the next five years, driven primarily by data centers, electrification, and manufacturing. However, the forecast is uncertain. DERs can be scaled to match load growth more effectively than larger resources, managing risk of overbuild and stranded assets.

Add load with efficient/limited investment in power system

Load

Prior studies identified 200 GW of cost-effective national potential in demand flexibility alone (roughly 20% of US peak demand). The potential is significantly higher when considering additional sources of flexibility such as distributed storage and data center flexibility. Innovation in regulatory models may be needed to align utility incentives with this opportunity.

Create or identify spare capacity on power system

Headroom

The Three Ways to Improve System Utilization

System utilization can be improved by adding new load when and where there is spare capacity. System headroom can be created through deployment of flexible distributed energy resources (DERs).

Add new load in locations where sufficient headroom already exists on the system.

Add new load at times when there is spare capacity. This is possible if the new customers are flexible and/or can self-supply during peak conditions.

Line graph of daily electricity load, showing a 'peak day' load, 'new flexible load' below capacity, and load shifting.

Incentivize technologies and behavioral changes that reduce peak demand of existing load. This creates new headroom on the system, which can then accommodate the addition of new load.

A before-and-after graph showing how reducing peak electrical load creates headroom to accommodate new load within capacity limits.

1

2

3

Calculate rate impact of adding load with focus on improving system utilization

Calculate rate impact of adding load without improving system utilization
(status quo)

Define illustrative characteristics of utility system and new load

Calculate rate impact of adding load with focus on improving system utilization

With a focus on improving system utilization, we consider a case in which the new load is accommodated on the power system with reduced investment in new infrastructure.

Half of the new transmission-level load is assumed to connect without imposing material new capacity costs on the system (e.g., through load flexibility during peak hours and/or self-supply from on-site generation).

Additionally, a 500 MW portfolio of distributed energy resources (demand flexibility, batteries, energy efficiency, EV managed charging, etc.) is developed at an average net cost of $50/kW-yr. The capacity contribution of the portfolio is derated to reflect that it offsets only a portion of the generation, transmission, and distribution infrastructure necessary to reliably serve the new load.

Calculate rate impact of adding load without improving system utilization (status quo)

Under the status quo scenario, we assume the new load growth will be served entirely through investment in traditional infrastructure. Specifically, 1,000 MW of additional generation and transmission capacity and 500 MW of distribution capacity will be developed to serve the new load.

The retail rate charged to the new load is strictly based on the utility’s embedded costs, and therefore does not fully recover the higher incremental cost associated with the newly developed infrastructure.

Any costs that are not recovered from the new load are assumed to be collected through a uniform rate increase for all customers (new and existing).

Define illustrative characteristics of utility system and new load

The illustrative utility has load characteristics that are broadly representative of a mid-sized U.S. investor-owned utility (e.g., 3,000 MW of peak demand and 43% generation capacity utilization).

The utility’s costs also broadly align with national averages. The utility’s average all-in retail rate is 14 cents/kWh. The utility’s marginal capacity costs are 30% higher than its embedded (average) costs, reflecting current inflationary trends.

We assume 1,000 MW of total new load will connect to the utility’s system in the near term: half will connect at the transmission level (e.g., data center), and half will connect at the distribution level (e.g., transportation electrification).

We analyze the rate impacts of adding load to an illustrative utility system for two scenarios: one scenario focuses on improving system utilization, and the other scenario does not.

Analysis Methodology

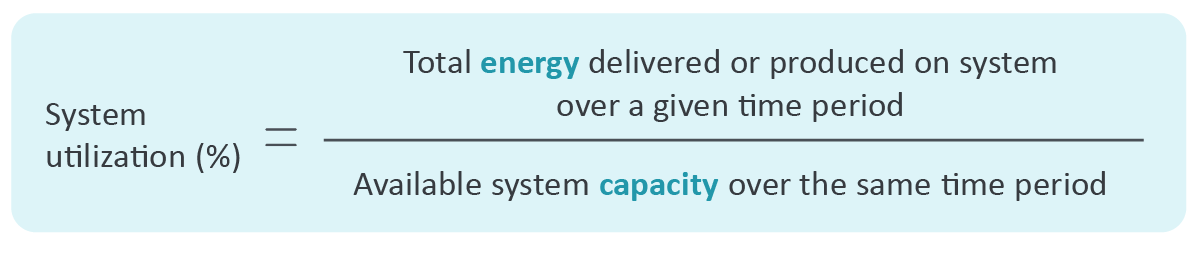
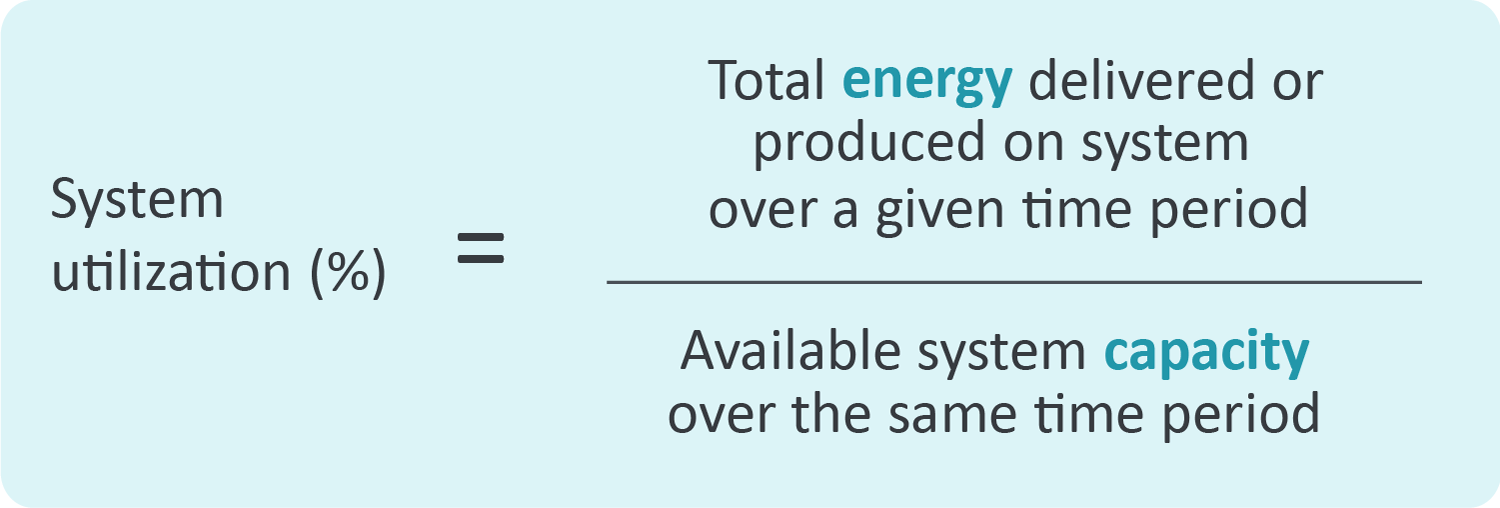
The illustrative utility has load characteristics that are broadly representative of a mid-sized US investor-owned utility (e.g., 3,000 MW of peak demand and 43% generation capacity utilization).

The utility’s costs also broadly align with national averages. The utility’s average all-in retail rate is 14 cents/kWh. The utility’s marginal capacity costs are 30% higher than its embedded (average) costs, reflecting current inflationary trends.

We assume 1,000 MW of total new load will connect to the utility’s system in the near term: half will connect at the transmission level (e.g., data center), and half will connect at the distribution level (e.g., transportation electrification).
Under the status quo scenario, we assume the new load growth will be served entirely through investment in traditional infrastructure. Specifically, 1,000 MW of additional generation and transmission capacity and 500 MW of distribution capacity will be developed to serve the new load.

The retail rate charged to the new load is strictly based on the utility’s embedded costs, and therefore does not fully recover the higher incremental cost associated with the newly developed infrastructure.

Any costs that are not recovered from the new load are assumed to be collected through a uniform rate increase for all customers (new and existing).
With a focus on improving system utilization, we consider a case in which the new load is accommodated on the power system with reduced investment in new infrastructure.

Half of the new transmission-level load is assumed to connect without imposing material new capacity costs on the system (e.g., through load flexibility during peak hours and/or self-supply from on-site generation).

Additionally, a 500 MW portfolio of DERs (such as demand flexibility, batteries, energy efficiency, and EV managed charging) is developed at an average net cost of $50/kW-yr. The capacity contribution of the portfolio is derated to reflect that it offsets only a portion of the generation, transmission, and distribution infrastructure necessary to reliably serve the new load.

The Rate Impacts of Improved System Utilization

All else equal, improving system utilization can reduce customer bills and accelerate the connection of new load while still allowing utility earnings to grow relative to current levels.

All-in Average Rate Impact Due to Load Growth

For various characterizations of the power system

Interpreting the Results

Proof-of-concept. The analysis is a plausible illustration of the benefits of improved system utilization; it is not a comprehensive analysis of all possible utility or market conditions. Tailored, jurisdiction-specific analysis is needed to understand the opportunities for any given system.

Other rate impacts. This study focuses only on the rate impacts associated with load growth and improved system utilization. It does not analyze other factors that could independently drive rate changes, such as replacement of aging transmission and distribution (T&D) infrastructure or fluctuations in natural gas prices.

Rate design. The “status quo” analysis assumes existing rates are insufficient to fully recover incremental cost from new load. In practice, rate design also can be an effective tool for mitigating cost shifts from new loads to existing customers.

Policy implications. This study quantifies the impact of increased system utilization, but does not propose specific policies or programs in this area.

A bar chart displays a 1.4% status quo, followed by decreasing negative percentages for alternative scenarios and utilization focus, down to -11.0%.
Bar chart showing percentage changes across scenarios: Status Quo (1.4%), Alternative Scenarios (-1.2% to -1.8%), and With Utilization Focus (-2.5% to -11.0%).

Status Quo

With load growth but no system utilization improvement, the cost of serving new customers exceeds the revenue that is collected from them. Rates increase for all customers by 1.4% to make up for the shortfall (all else equal).

With Utilization Focus

By increasing annual system utilization by 10%, the new load is integrated at lower-than-average costs. Relative to current conditions, rates for all customers can be reduced by 3.4% (or by 4.8% relative to the status quo load growth scenario), utility earnings increase, and connection of the new load to the power system can be accelerated by several years.

Alternative Scenarios

Analysis of alternative scenarios shows that there is significant upside if the DERs used to improve system utilization are more impactful or available at a lower cost than assumed in the base case. More conservative assumptions still result in downward rate pressure.

Benefits to New Loads

Cost-effective solutions for improving system utilization allow new customers to connect to the grid without shifting costs to other consumers, addressing an escalating policy concern. These solutions also mitigate the stranded asset risk of overbuilding the power system if new load does not materialize at the level or pace forecasted, as efficiency, flexibility, and DERs can be scaled to match load growth more effectively than larger resources. Lastly, distributed resources can be brought online more quickly than other options, accelerating speed-to-market.

Benefits to Utilities

Improving system utilization is a strategy for efficient load growth. In our analysis, a focus on improving system utilization lessens but does not eliminate the need to invest in new generation, transmission, and distribution capacity. As a result, utility revenues and earnings will still grow relative to current levels. This focus on efficient growth will allow utilities to focus capital deployment on the most critical infrastructure projects while also being a key enabler of economic development.

Benefits to Consumers

Analysts project that annual U.S. electricity sales will increase by 20-30% over the next five years. Scaling this study’s utility-level findings to that level of national load growth indicates that U.S. consumers could save $150 to $180 billion over ten years on their electricity bills due to system utilization improvements. Participants in programs or rates that incentivize peak demand reductions will experience additional savings through enrollment incentives.

At a national scale, improving system utilization can be a win for consumers, utilities, and new loads.

National Implications

Ensuring Beneficial Outcomes

System utilization is a simple concept, but thoughtful attention to key details can help ensure the beneficial outcomes identified in this study are realized.

Example Principles to Ensure Beneficial Outcomes

Formula for calculating system utilization: total energy delivered divided by available system capacity.
Certain fundamental factors outside a utility’s control will influence the system’s utilization level. For example, large industrial customers tend to have higher load factors than residential customers; a utility with a larger industrial base may naturally have higher system utilization as a result. Policies encouraging improvements in system utilization should take these utility-specific conditions into account. In other words, the focus of new utilization initiatives should be on incremental improvement from existing levels, rather than attainment of a single utilization value that is considered to be “universal” across all utility territories.
The rate paid by new load will influence the extent to which improved utilization reduces rates for existing customers. Higher rates for new loads, relative to the cost of serving that new load, will improve the outcome for existing customers. Relatedly, cost allocation is an important consideration in the ratemaking process; new methods may need to be developed to ensure that the benefits of improved system utilization are realized by all customers and not restricted to specific customer classes.
Improved system utilization is not an end in itself; it is valuable to the extent that it helps lower total system costs and, ultimately, customer rates. Regulators therefore need to ensure that strategies used to raise utilization – such as deploying DERs – are more cost-effective than conventional grid investments that would otherwise be required. In other words, initiatives aimed at improving operational efficiency should be evaluated not only on whether they increase utilization, but also on whether they deliver net cost savings and improve overall cost efficiency.
There are levels at which higher system utilization could produce diminishing benefits or even additional costs. For example, the distribution system benefits from times of reduced load for electrical equipment to cool. Further, some excess system capacity is needed to allow equipment to be taken offline for maintenance or to prepare for extreme weather conditions. Goals for improving system utilization should take these limits into account.
Aggregate generator data is typically available from utility resource plans, ISO/RTO annual capacity reports, or public sources such as the US Energy Information Administration’s (EIA’s) Form 860 and Form 923. However, grid security considerations may prevent detailed transmission and distribution data from being reported publicly. It may be necessary for system operators to report utilization metrics at aggregated levels, potentially subject to confidential review by regulatory commissions. Utilities increasingly are publishing hosting capacity data with this information for the distribution system.

Calculate rate impact of adding load with focus on improving system utilization

Calculate rate impact of adding load without improving system utilization
(status quo)

Define illustrative characteristics of utility system and new load

Calculate rate impact of adding load with focus on improving system utilization

With a focus on improving system utilization, we consider a case in which the new load is accommodated on the power system with reduced investment in new infrastructure.

Half of the new transmission-level load is assumed to connect without imposing material new capacity costs on the system (e.g., through load flexibility during peak hours and/or self-supply from on-site generation).

Additionally, a 500 MW portfolio of distributed energy resources (demand flexibility, batteries, energy efficiency, EV managed charging, etc.) is developed at an average net cost of $50/kW-yr. The capacity contribution of the portfolio is derated to reflect that it offsets only a portion of the generation, transmission, and distribution infrastructure necessary to reliably serve the new load.

Calculate rate impact of adding load without improving system utilization (status quo)

Under the status quo scenario, we assume the new load growth will be served entirely through investment in traditional infrastructure. Specifically, 1,000 MW of additional generation and transmission capacity and 500 MW of distribution capacity will be developed to serve the new load.

The retail rate charged to the new load is strictly based on the utility’s embedded costs, and therefore does not fully recover the higher incremental cost associated with the newly developed infrastructure.

Any costs that are not recovered from the new load are assumed to be collected through a uniform rate increase for all customers (new and existing).

Define illustrative characteristics of utility system and new load

The illustrative utility has load characteristics that are broadly representative of a mid-sized U.S. investor-owned utility (e.g., 3,000 MW of peak demand and 43% generation capacity utilization).

The utility’s costs also broadly align with national averages. The utility’s average all-in retail rate is 14 cents/kWh. The utility’s marginal capacity costs are 30% higher than its embedded (average) costs, reflecting current inflationary trends.

We assume 1,000 MW of total new load will connect to the utility’s system in the near term: half will connect at the transmission level (e.g., data center), and half will connect at the distribution level (e.g., transportation electrification).

This study is the beginning, not the end, of the discussion on the benefits of improved system utilization.

Our study has highlighted the potential for load growth to be an energy affordability solution, rather than a problem. Specifically, the study has shown that improvements in system utilization through load growth can put downward pressure on rates for consumers, while accelerating the connection of new load and reducing financial risk. Work remains to ensure initiatives in this area achieve the desired energy affordability outcomes. We recommend the following next steps.

Moving Forward

Data Collection

Measuring system utilization requires assembling the right data. Generation utilization metrics are often available from public sources, but transmission and distribution capacity ratings and limits are frequently confidential. To fill these gaps, regulators and analysts should work with utilities and system operators to establish clear data definitions, confidentiality protections, and data-sharing processes.

System Characterization

Setting utilization targets requires an accurate characterization of the system in question. Utilities differ in key drivers of utilization – such as customer mix, climate, infrastructure age and condition, and network topology. Regulators and utilities should document these factors up front and design utilization initiatives and benchmarks that reflect local constraints and operating realities, rather than applying one-size-fits-all targets.

Potential Assessment​

Improving system utilization requires identifying the options that are feasible and cost-effective for a specific utility. The best opportunities will vary; some systems may benefit most from targeted energy efficiency, while others may find greater value in distributed batteries or load flexibility, for example. Developing a “supply curve” of utilization-improvement options, ranked by cost and potential impact, helps regulators and utilities design informed, least-cost initiatives.

Implementation Plan

Market, regulatory, and technical barriers can limit how effectively utilization tools deliver value. Alongside evaluating cost-effectiveness, utilities, regulators, and service providers should assess near-term feasibility by identifying the specific barriers that constrain deployment or operations. Where benefits justify it, they should pursue targeted reforms, such as rule changes or interconnection/process improvements, to remove barriers and unlock longer-term, system-wide optimization.

Presentation slide on 'The Untapped Grid' for GridLab and Utilize Coalition, showing a power line.

Read Anytime, Anywhere

Access the PDF version of our guide for easy offline viewing and sharing. To learn more, please contact our report authors.

authors

about brattle

The Brattle Group answers complex economic, regulatory, and financial questions for corporations, law firms, and governments around the world. We aim for the highest level of client service and quality in our industry.

We are distinguished by our credibility and the clarity of our insights, which arise from the stature of our experts; affiliations with leading international academics and industry specialists; and thoughtful, timely, and transparent work. Our clients value our commitment to providing clear, independent results that withstand critical review.

Brattle has 500 talented professionals across four continents. For additional information about our experts and services, please visit brattle.com

Facial expression, Forehead, Nose, Cheek, Smile, Head, Chin, Shirt, Eyebrow, Beard
Headshot of an Asian man in a suit smiling, wearing glasses.
Headshot of a smiling young woman with long, wavy blonde hair and blue eyes, wearing a black shirt.

Kate Peters

Energy Associate

Ryan Hledik

Principal

Long Lam

Managing Energy Associate